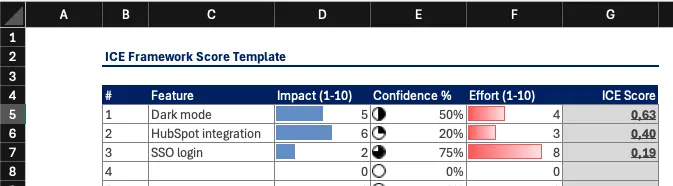
Looking for an ICE prioritization template? We've created a simple ICE framework spreadsheet in Excel that you can download and use right away:
👉 Download ICE Prioritization Template
🚀 Use ICE in ProductLift. Automatic scoring, team collaboration, and roadmap generation
ICE is a prioritization framework (also called the ICE scoring model or ICE matrix) that stands for Impact, Confidence, and Ease. It helps product managers and teams evaluate initiatives based on these three straightforward factors:
These three ICE criteria help teams make objective decisions quickly. By multiplying these factors, the ICE score provides an easy-to-understand way to prioritize tasks, ensuring that teams focus on initiatives with the highest potential.
For a deeper dive into the ICE prioritization method, check out: Understanding ICE Prioritization
The ICE scoring model was popularized by growth expert Sean Ellis, who coined the term "growth hacking" and founded GrowthHackers.com. Ellis introduced ICE as a lightweight way for growth teams to rank experiments when time was short and analytics were incomplete. His original framing:
"The Ice Score allows you to assign a score of 1 to 10 for each of the three components of the Ice Score. Then simply add up the scores to get the total Ice Score. The higher the score, the better the idea." (Sean Ellis, GrowthHackers)
Ellis's original write-up added the three numbers rather than multiplying them. Modern product teams overwhelmingly multiply Impact × Confidence × Ease instead, because multiplication punishes low-confidence bets more aggressively and creates wider score separation between strong and weak ideas. Both variants are considered "canonical ICE" today, and the template below uses the multiplicative version.
Each component of ICE serves a distinct purpose. Understanding what they mean in practice is the difference between useful scores and random numbers.
Impact measures the expected positive effect of an initiative on your key metric. That metric could be revenue, user engagement, conversion rate, or customer satisfaction. The important thing is that your entire team agrees on which metric matters before scoring begins.
Most teams use a 1 to 10 scale:
Some teams prefer a 1 to 5 scale for simplicity. Either works as long as you stay consistent across all items in a single scoring session.
Confidence captures how sure you are about your Impact and Ease estimates. This is the honesty check. Without it, teams tend to score optimistically and end up chasing features that looked great on paper but delivered little in practice.
Ease reflects how straightforward the implementation is. It accounts for engineering effort, design complexity, dependencies on other teams, and potential technical debt. Note that some teams use "Effort" instead of "Ease" and invert the scale. In the standard ICE model, higher Ease scores mean less effort required.
The final ICE score is simply I x C x E. A feature scoring 8 x 7 x 9 = 504 should be prioritized above one scoring 9 x 5 x 4 = 180, even though the second feature has a higher raw impact. Try the ICE Calculator to experiment with different scoring combinations.
RICE adds a fourth component called Reach, which quantifies how many users a feature will affect over a given time period. ICE folds that consideration into the Impact score instead of tracking it separately. This makes ICE faster to use but less precise when you have reliable user data. For a full breakdown of the tradeoffs, read our RICE vs ICE comparison.
Choosing between ICE and RICE depends on your team size, data maturity, and how fast you need to make decisions.
| Criteria | ICE is the better fit | RICE is the better fit |
|---|---|---|
| Team size | Small teams (under 10) | Larger product orgs with multiple squads |
| Available data | Limited analytics or early stage | Rich user metrics and reach data |
| Decision speed | Need to prioritize in under 30 minutes | Willing to invest time for precision |
| Use case | Growth experiments, quick iterations | Quarterly roadmap planning |
| Scoring overhead | 3 factors per item | 4 factors per item plus reach estimation |
| Accuracy | Good enough for rapid prioritization | More rigorous when data is available |
If you find ICE too lightweight and RICE too heavy, consider MoSCoW for categorical prioritization or explore our RICE template as an alternative spreadsheet.
Abstract scoring guidelines only go so far. Here are three concrete examples showing how different teams would apply ICE to real decisions.
In this comparison, the SSO feature wins despite being the hardest to build, because the Impact and Confidence scores are both very high. The Confidence factor is doing the heavy lifting here. That is exactly why it exists.
Running ICE as a solo exercise works, but the framework delivers much better results as a team activity. Here is a step by step guide for running an ICE scoring session with your product team.
Sort items by ICE score and move the top ranked items into your roadmap. Revisit scores monthly or whenever new data arrives that would change your Confidence rating.
ICE is simple by design, but that simplicity creates a few recurring traps.
Teams consistently rate Confidence too high. If you have not validated an assumption with real users, your Confidence should be 5 or below. A useful rule of thumb: unless you can point to specific data that supports your estimate, score Confidence at 4.
When the first person shares their scores out loud, everyone else adjusts toward that number. This is why the workshop guide above recommends scoring individually first. If you skip that step, you are essentially getting one person's opinion with extra steps.
Some teams treat Ease as an afterthought and give everything a 6 or 7. This defeats the purpose. A feature that scores 10 on Impact but 2 on Ease is not the same as one scoring 8 on Impact and 8 on Ease. The second feature ships faster and delivers value sooner.
Scoring inflation creeps in over time. A feature that would have scored a 6 on Impact three months ago suddenly scores an 8 because the team recalibrates unconsciously. Reset your scale at the start of each session by referencing a known item as a benchmark.
Remember that Ease and Effort are inverses. High Ease means low effort. If your team uses "Effort" in the template, make sure the formula divides by Effort instead of multiplying. Getting this wrong will rank your hardest features at the top.
Our Excel-based ICE prioritization template is designed to be:
Grab the file here: 👉 Download ICE Prioritization Template (.xlsx). No email gate, no signup, no watermark. The download is a standard .xlsx workbook with the ICE formula pre-wired into the Score column, ready to use in Excel, Google Sheets, or Numbers. If you want the ICE calculation without leaving the browser, use the free ICE Calculator instead.
To use the ICE template in Excel:
.xlsx file from the link above.=I*C*E and updates automatically as you type.=I*C/E and invert your scale (higher Effort = worse). Do not leave the sheet with mixed conventions.Google Sheets opens .xlsx files natively, so there is no separate Google Sheets file to download:
.xlsx template using the link above.=I*C*E formula converts cleanly. All conditional formatting on the Score column is preserved.If you would rather score inside a product management tool that stores history, versions, and comments, use the ICE Prioritization board in ProductLift instead of a spreadsheet.
Numbered walkthrough for either the Excel or Google Sheets version:
Worked example already in the template: the Scoring Sheet ships with three sample rows (the SaaS SSO, e-commerce one-click reorder, and mobile push personalization examples from the Scoring Examples section above). Delete them before adding your own items, or keep them as reference anchors while you score.
For quick calculations without downloading the Excel file, try this free online ICE prioritization tool: ICE Calculator. This ICE scoring system lets you calculate scores instantly and is a great companion to the spreadsheet template.
The ICE framework for prioritization allows you to:
Whether you're managing a product team or working solo, the ICE prioritization template helps you focus on what matters most.
Looking for more prioritization framework templates? Check out these alternatives:
All our prioritization templates are free to download and use.
Join over 5,204 product managers and see how easy it is to build products people love.
Did you know 80% of software features are rarely or never used? That's a lot of wasted effort.
SaaS software companies spend billions on unused features. In 2025, it was $29.5 billion.
We saw this problem and decided to do something about it. Product teams needed a better way to decide what to build.
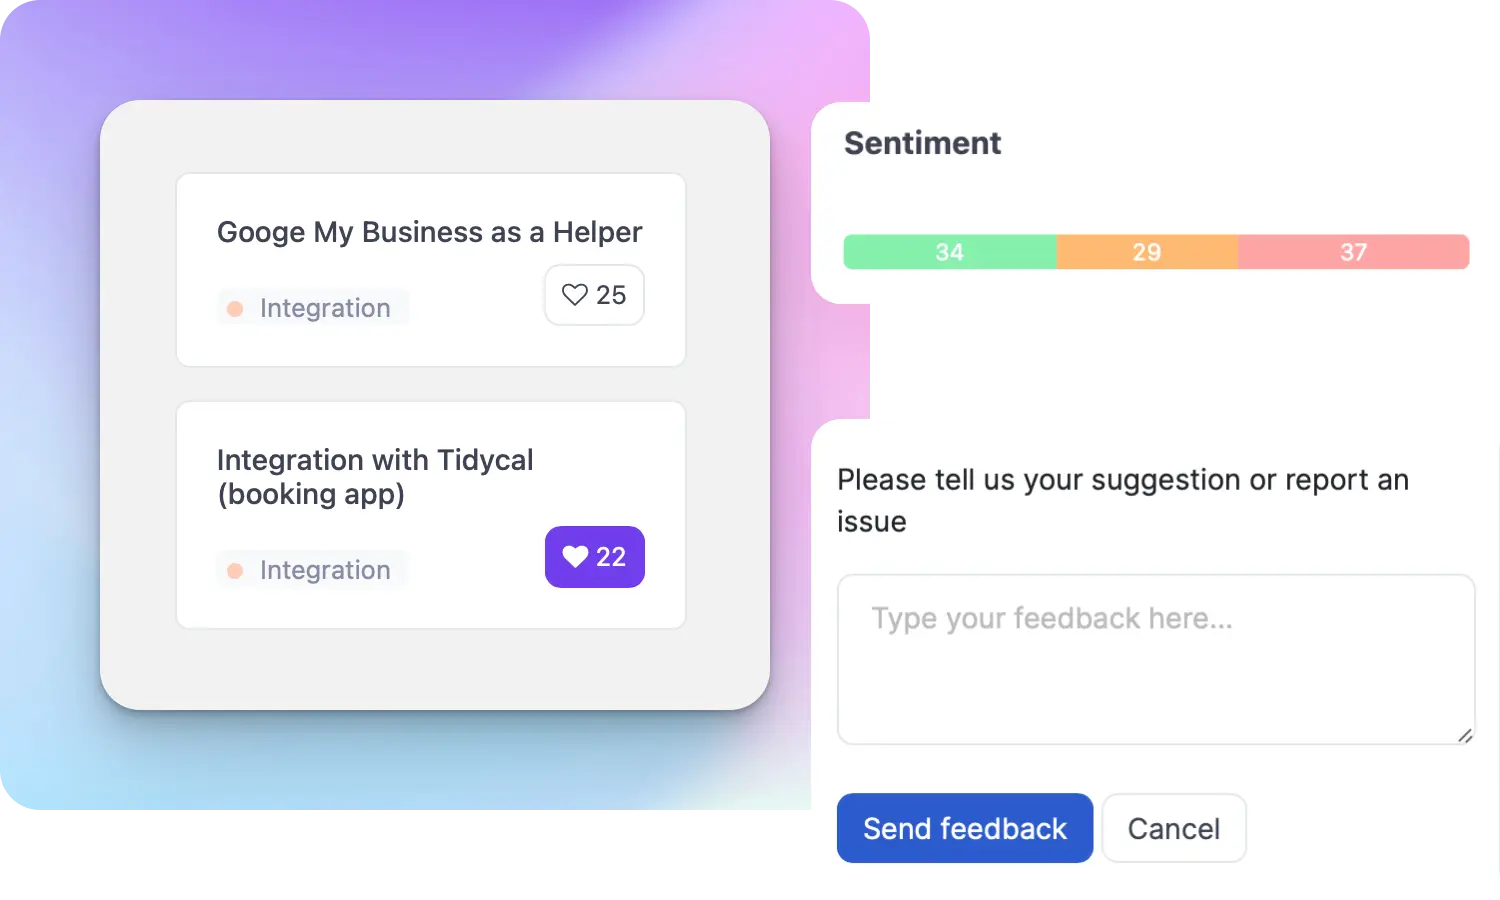
That's why we created ProductLift - to put all feedback in one place, helping teams easily see what features matter most.
In the last five years, we've helped over 5,204 product teams (like yours) double feature adoption and halve the costs. I'd love for you to give it a try.

Founder & Digital Consultant
See how real product teams use RICE, ICE, MoSCoW, and other prioritization frameworks. 6 practical examples with actual scores, decisions, and outcomes.
A practical guide for choosing the right prioritization framework. Answer 4 questions to find the best fit for your team size, data, and decisions.
Compare 10 prioritization frameworks side by side. RICE, ICE, MoSCoW, Kano, and more scored on complexity, data needs, and best use cases.
The best prioritization frameworks for startups at every stage. From pre-PMF to growth, learn which framework fits your team size, data, and speed requirements.
Learn when to promote feature requests to your roadmap, how to merge duplicates, notify voters, and keep credibility through the full lifecycle.
With bike energy  from Utrecht
Ruby Foundry B.V. - KVK: 99995662 - BTW: NL869219789B01