Looking for a RICE template? We've created a collection of free RICE prioritization templates available in various formats:
Want to skip the spreadsheet? Apply RICE scoring directly in ProductLift.
RICE is a prioritization framework developed by Intercom's product team. It stands for Reach, Impact, Confidence, and Effort. By scoring every feature request or initiative across these four dimensions, you get a single number that ranks ideas objectively instead of relying on gut feeling or the loudest voice in the room.
The formula is straightforward:
RICE Score = (Reach x Impact x Confidence) / Effort
For a full walkthrough of the framework with scored examples, read the RICE Prioritization Guide.
Reach: The number of users or customers who will be affected by a feature within a defined time period (usually one quarter). Reach keeps you honest about audience size. A feature that delights 10 power users scores differently than one that helps 5,000 trial users convert.
Impact: How much the feature moves the needle for each person it reaches. Most teams use a scale from 0.25 (minimal) to 3 (massive). Impact forces you to separate "nice to have" improvements from changes that genuinely shift user behavior.
Confidence: A percentage reflecting how sure you are about the Reach and Impact estimates. If your numbers come from analytics data, confidence might be 100%. If they come from a hunch during a brainstorm, 50% is more appropriate. This factor penalizes guesswork and rewards evidence.
Effort: The total amount of work required, measured in person-months (or person-weeks, depending on your team). Effort sits in the denominator, so high-effort projects need proportionally higher reach, impact, and confidence to justify their cost.
Imagine your SaaS product receives a popular request: "Add a dark mode option to the dashboard."
Here is how you might score it:
RICE Score = (1,800 x 1 x 0.8) / 0.5 = 2,880
Now compare that to another request: "Build a Jira integration."
RICE Score = (400 x 2 x 0.9) / 3 = 240
Dark mode scores higher because it touches a much larger audience relative to the effort required. Without RICE, the Jira integration might have won simply because enterprise customers asked for it loudly. The framework surfaces the tradeoff clearly.
You can plug your own numbers into the RICE Calculator to run quick comparisons without a spreadsheet.
RICE is not the only prioritization framework. Choosing the right one depends on your team size, data maturity, and the type of decisions you are making. Here is a quick comparison:
RICE vs ICE: ICE scoring uses Impact, Confidence, and Ease (the inverse of Effort). It drops Reach entirely, which makes it faster but less precise for products with large, segmented user bases. ICE works well for growth experiments where speed matters more than granularity. If you want an ICE template, see the ICE prioritization template.
RICE vs MoSCoW: MoSCoW sorts features into Must Have, Should Have, Could Have, and Won't Have buckets. It is a qualitative method that works well for release planning within a fixed scope, but it does not produce numerical rankings. Use MoSCoW when you need stakeholder alignment on scope, and RICE when you need data-driven ranking.
RICE vs Impact-Effort Matrix: The classic 2x2 matrix plots ideas by impact and effort. It is visual and intuitive, but it lacks the nuance of Reach and Confidence. Teams that want a quick visual filter often start with Impact-Effort, then apply RICE to the high-impact quadrant for final ranking.
When RICE is the right choice: Use RICE when you have access to user data (analytics, surveys, or customer conversations), when your backlog is large enough that subjective sorting breaks down, and when you need a defensible rationale for prioritization decisions.
Each template format suits a different workflow. Use this table to pick the right one:
| Format | Best For | Collaboration | Auto-Calculation | Link |
|---|---|---|---|---|
| Excel | Offline work, advanced formulas, pivot tables | Limited (file sharing) | Yes | Download |
| Google Sheets | Real-time team collaboration, remote teams | Excellent (live editing) | Yes | Open |
| PowerPoint | Stakeholder presentations, board meetings | Moderate | No | Download |
| Notion | Teams already using Notion for docs and tasks | Excellent | Yes (formulas) | Open |
| Miro | Visual brainstorming, workshop facilitation | Excellent (real-time) | No | Open |
Choose Excel when you need to work offline, handle large datasets, or create custom charts and pivot tables from your RICE scores.
Choose Google Sheets when multiple team members need to edit at the same time. It is the most popular option for distributed teams.
Choose PowerPoint when you need to present prioritization results to leadership or stakeholders who do not interact with spreadsheets.
Choose Notion or Miro when your team already lives in those tools and you want prioritization data alongside your existing workflows.
The RICE formula is only as good as the numbers you feed it. Here are practical ways to improve each estimate:
Even teams that adopt RICE with good intentions can undermine it with a few recurring pitfalls:
All of our RICE prioritization templates are designed to be:
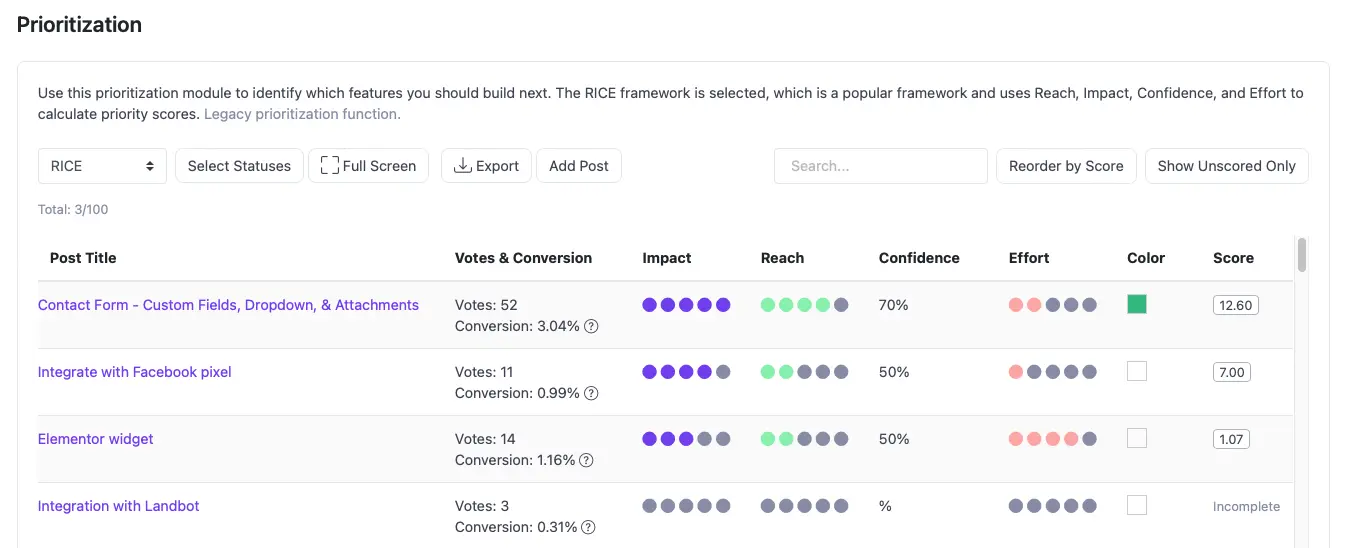
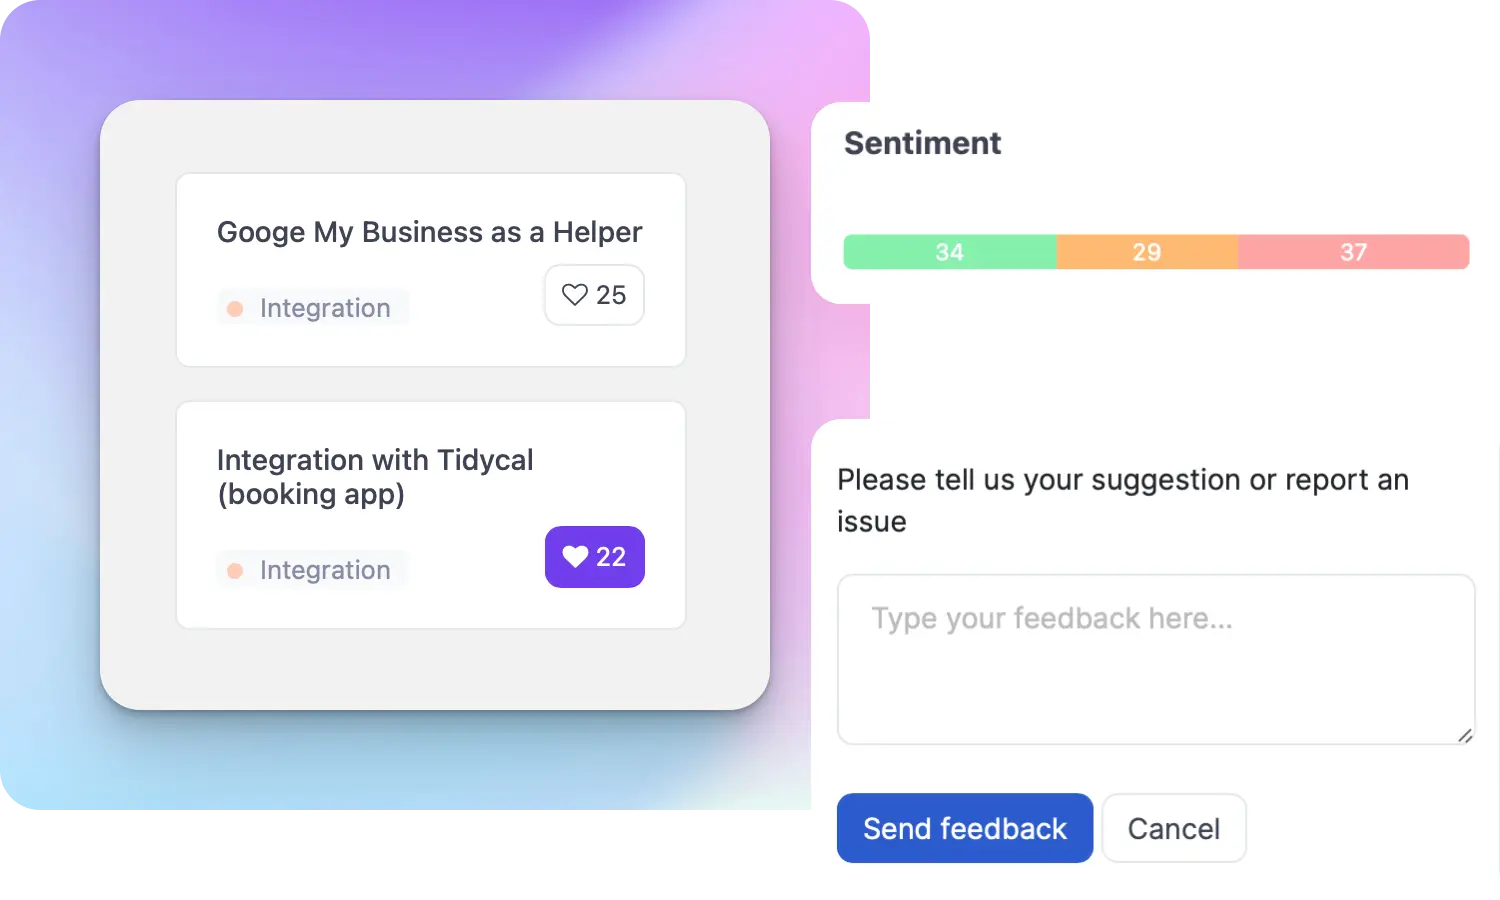
While templates are great for one-off prioritization sessions, managing ongoing product decisions requires a more robust tool. ProductLift's RICE prioritization feature offers a dynamic platform where you can:
For quick calculations without downloading a template file, try the online RICE Calculator. Enter your Reach, Impact, Confidence, and Effort values and get an instant score.
Join over 5,204 product managers and see how easy it is to build products people love.
Did you know 80% of software features are rarely or never used? That's a lot of wasted effort.
SaaS software companies spend billions on unused features. In 2025, it was $29.5 billion.
We saw this problem and decided to do something about it. Product teams needed a better way to decide what to build.
That's why we created ProductLift - to put all feedback in one place, helping teams easily see what features matter most.
In the last five years, we've helped over 5,204 product teams (like yours) double feature adoption and halve the costs. I'd love for you to give it a try.

Founder & Digital Consultant
See how real product teams use RICE, ICE, MoSCoW, and other prioritization frameworks. 6 practical examples with actual scores, decisions, and outcomes.
A practical guide for choosing the right prioritization framework. Answer 4 questions to find the best fit for your team size, data, and decisions.
Compare 10 prioritization frameworks side by side. RICE, ICE, MoSCoW, Kano, and more scored on complexity, data needs, and best use cases.
The best prioritization frameworks for startups at every stage. From pre-PMF to growth, learn which framework fits your team size, data, and speed requirements.
Learn when to promote feature requests to your roadmap, how to merge duplicates, notify voters, and keep credibility through the full lifecycle.
With bike energy  from Utrecht
Ruby Foundry B.V. - KVK: 99995662 - BTW: NL869219789B01