Looking for a RICE template for Excel? We've created a simple RICE scoring spreadsheet that you can download and use right away:
👉 Download RICE Prioritization Template
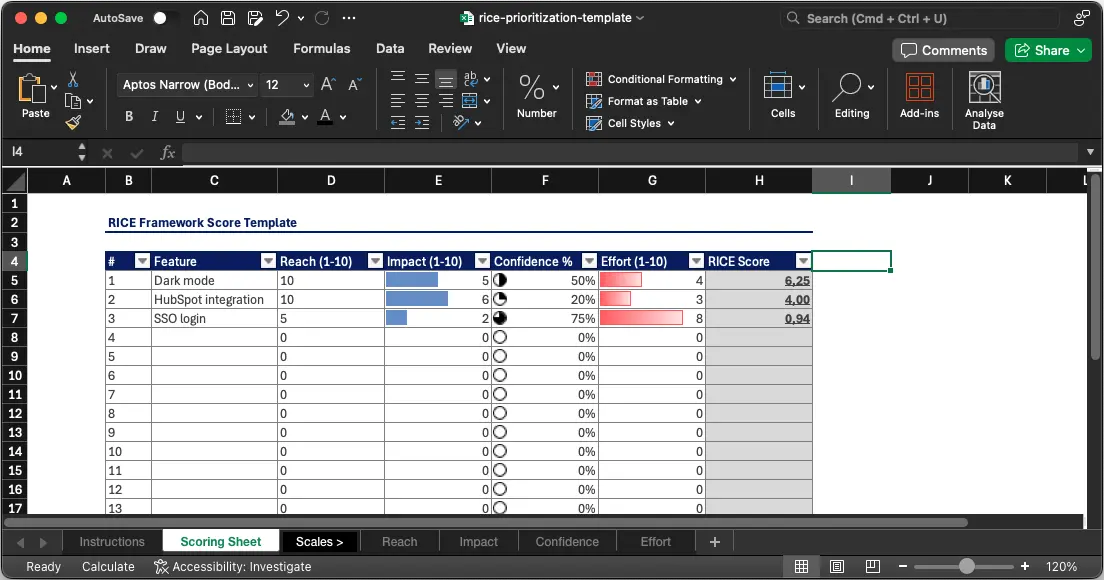
Before opening Excel, here is exactly what a RICE calculation looks like on a real feature. This is the template already filled in for a single row so you can sanity check the formula.
Feature: Add SSO login for enterprise plans.
RICE score = (5000 × 3 × 0.8) / 2 = 6,000
Sort your backlog by this column descending and the feature with the highest number is the one to build next. Use this same pattern for every row.
What is a RICE template?
A RICE template is a prioritization spreadsheet with four scoring columns (Reach, Impact, Confidence, Effort) and one calculated column that multiplies Reach × Impact × Confidence and divides by Effort. Sort by the calculated column to see which feature to build next.
How do you calculate RICE score in Excel?
Enter your four inputs in columns B (Reach), C (Impact), D (Confidence as a decimal), and E (Effort). In the RICE Score column (F), type =B2*C2*D2/E2 and drag it down. Excel recalculates every score instantly.
What is a good RICE score?
There is no universal cutoff. RICE scores are only meaningful relative to your own backlog. Rank features against each other and pick the highest scoring items that fit your capacity. A score of 6,000 might be top of the list in one backlog and middle of the pack in another.
Who invented the RICE framework?
RICE was introduced by Sean McBride on the Intercom blog in January 2018 as the scoring system Intercom's product team was using internally. It has since become one of the most widely adopted lightweight prioritization frameworks.
RICE is a prioritization framework that stands for Reach, Impact, Confidence, and Effort. Product teams use it to compare features, initiatives, and ideas on a level playing field so that the highest value work rises to the top. Each factor captures a different dimension of the decision, and the final score combines them into a single number you can sort by.
For a complete walkthrough with real world examples, check out our RICE Prioritization Guide.
The RICE score formula used in this Excel template is:
RICE Score = (Reach × Impact × Confidence) / Effort
Here is what each variable means and how it maps to cells in the spreadsheet:
If your feature row starts on row 2, the formula in the RICE Score column (F2) looks like this:
=B2*C2*D2/E2That single formula multiplies Reach, Impact, and Confidence together, then divides by Effort. Copy it down for every row, and Excel recalculates each score instantly.
Want to skip the spreadsheet entirely? Try the online RICE Calculator for quick one off calculations.
Follow these steps to build the template from scratch or customize the one you downloaded.
Set up row 1 with the following headers:
| A | B | C | D | E | F |
|---|---|---|---|---|---|
| Feature | Reach | Impact | Confidence | Effort | RICE Score |
In cell F2, type =B2*C2*D2/E2 and press Enter. Then select F2, grab the fill handle in the bottom right corner, and drag it down to cover all your rows.
Enter three or four features with realistic numbers so you can verify the formula works before filling in the rest of your backlog.
Select the entire data range, go to Data > Sort, and sort column F from largest to smallest. The feature with the highest score is your top priority.
Once the basics are in place, these enhancements make the template significantly more useful.
Highlight the RICE Score column, go to Home > Conditional Formatting > Color Scales, and pick a three color scale (green for high, yellow for medium, red for low). This gives you an instant visual ranking so the winning features stand out at a glance.
You can also add a rule that bolds any row where the RICE Score exceeds a threshold you define. For example, select the entire data range, choose "New Rule" > "Use a formula," and enter =$F2>500. Set the format to bold with a light green fill.
Instead of letting anyone type arbitrary numbers, lock Impact and Confidence to their standard scales.
For Impact (column C): select the cells, go to Data > Validation, choose "List," and enter 0.25,0.5,1,2,3. Now users pick from a dropdown, eliminating guesswork and typos.
For Confidence (column D): do the same with a list of 0.5,0.8,1. These correspond to low, medium, and high confidence.
If you want the sheet to stay sorted without manually re sorting, add a helper column that uses RANK:
=RANK(F2, $F$2:$F$100, 0)This gives each feature a rank number. You can then sort by that column, or use conditional formatting to highlight the top 5 items.
Select cell A2 and go to View > Freeze Panes > Freeze Top Row. This keeps your headers visible as you scroll through a long backlog.
Even a simple formula can produce wrong results if you are not careful. Watch out for these pitfalls:
Forgetting to use decimals for Confidence. If you enter 80 instead of 0.8, your RICE score will be 100 times too high. Either format the column as a percentage or add a note reminding users to enter values between 0 and 1.
Dividing by zero in the Effort column. Leaving Effort blank or entering 0 causes a #DIV/0! error. To handle this gracefully, wrap your formula in an IFERROR function:
=IFERROR(B2*C2*D2/E2, 0)This returns 0 instead of an error when Effort is missing.
Wrong cell references after copying. If you copy the formula from one sheet to another, Excel may adjust the references. Always double check that each row's formula points to the correct cells. Using the F2 (Edit) key to step into a formula helps you see which cells it references.
Mixing up absolute and relative references. The RICE formula should use relative references (B2, C2, etc.) so it shifts row by row when you drag it down. If you accidentally add dollar signs ($B$2), every row will calculate the same score.
Using inconsistent scales. If one team member scores Impact on a 1 to 5 scale while another uses the standard 0.25 to 3 scale, scores become meaningless. Document your scales in a "Legend" sheet or use the data validation dropdowns described above.
Excel is a solid choice for RICE scoring when:
If your team prefers working in a browser, the Google Sheets version offers the same template with real time collaboration built in.
Prefer a different format? Google Sheets version | PowerPoint version
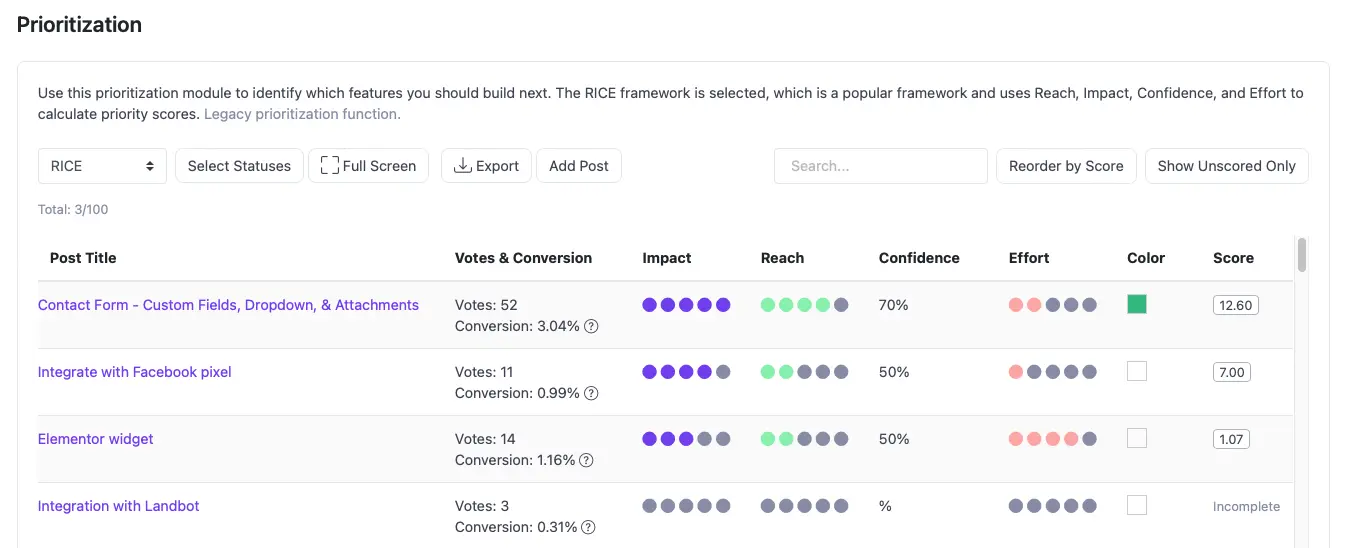
While this Excel template is great for quick calculations, managing prioritization over time can become complex with spreadsheets. Version control is manual, collaboration requires emailing files back and forth, and there is no easy way to connect scores to your actual product backlog. For a more robust and collaborative approach, consider using ProductLift's RICE prioritization feature. With ProductLift, you can:
For quick calculations without downloading the Excel file, try the online RICE Calculator. Enter your four values and get an instant score. It is especially handy when you need to score a single feature during a meeting or discussion.
Whether you choose Excel, Google Sheets, PowerPoint, or another format, our RICE templates hub has every version covered. And if you are looking for a solution that grows with your team and product, ProductLift offers the tools you need for long term success.
Join over 5,204 product managers and see how easy it is to build products people love.
Did you know 80% of software features are rarely or never used? That's a lot of wasted effort.
SaaS software companies spend billions on unused features. In 2025, it was $29.5 billion.
We saw this problem and decided to do something about it. Product teams needed a better way to decide what to build.
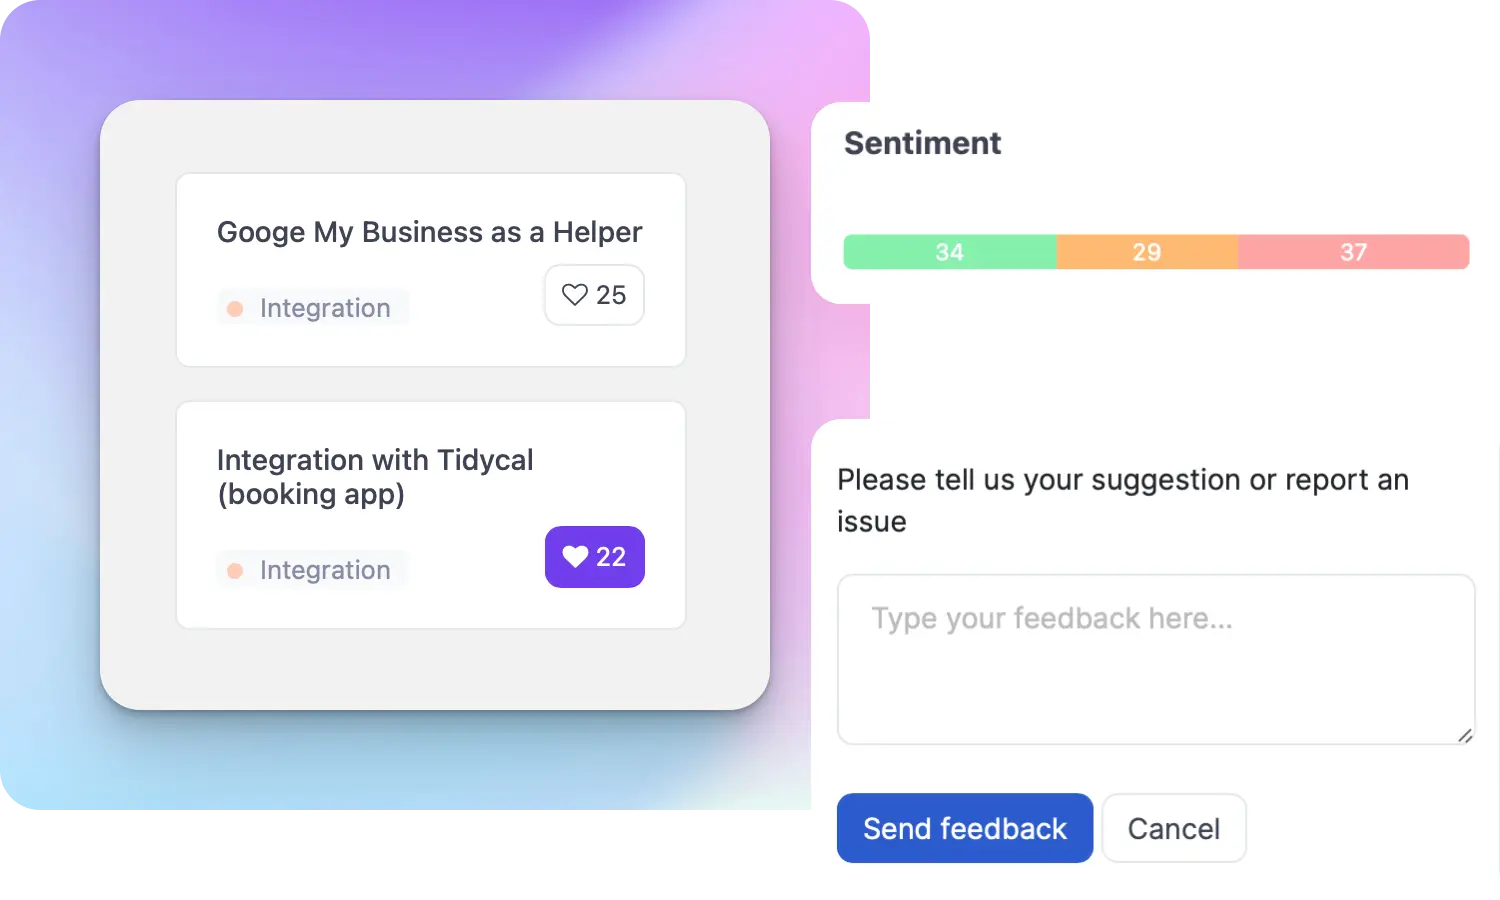
That's why we created ProductLift - to put all feedback in one place, helping teams easily see what features matter most.
In the last five years, we've helped over 5,204 product teams (like yours) double feature adoption and halve the costs. I'd love for you to give it a try.

Founder & Digital Consultant
See how real product teams use RICE, ICE, MoSCoW, and other prioritization frameworks. 6 practical examples with actual scores, decisions, and outcomes.
A practical guide for choosing the right prioritization framework. Answer 4 questions to find the best fit for your team size, data, and decisions.
Compare 10 prioritization frameworks side by side. RICE, ICE, MoSCoW, Kano, and more scored on complexity, data needs, and best use cases.
The best prioritization frameworks for startups at every stage. From pre-PMF to growth, learn which framework fits your team size, data, and speed requirements.
Learn when to promote feature requests to your roadmap, how to merge duplicates, notify voters, and keep credibility through the full lifecycle.
With bike energy  from Utrecht
Ruby Foundry B.V. - KVK: 99995662 - BTW: NL869219789B01