RICE Prioritization Framework for Product Teams

Use the RICE scoring model to prioritize features objectively. Calculate Reach × Impact × Confidence ÷ Effort and build what matters most.

4.8 on G2
6,000+ teams
Free trial
Aaron Dye Timothy M. Ben Marco Chris R.
from 124+ reviews
ProductLift RICE prioritization interface
G2 High Performer G2 Best ROI G2 High Performer Small Business G2 Most Likely to Recommend
6,035 Teams
157K Prioritized
39K Shipped

What is RICE Prioritization? The 4 Scoring Factors

RICE is a prioritization framework that scores features across four factors to find your highest-impact opportunities

1

Reach

How many users will this feature affect in a given time period? Estimate the number of customers or transactions impacted.

2

Impact

How much will this feature improve the user experience? Score from minimal (0.25) to massive (3) impact per user.

3

Confidence

How confident are you in your estimates? Use percentage (100% = high confidence, 50% = low) to account for uncertainty.

4

Effort

How much work will this take? Estimate in person-months or story points. Higher effort = lower priority.

Why Use RICE Scoring for Feature Prioritization?

See how the RICE framework transforms product decision-making

Before

With ProductLift

Endless debates over which features to build
Objective RICE scores settle discussions fast
Building whatever's loudest in the room
Building what reaches the most users
Guessing at feature impact
Data-backed impact estimates
No way to compare apples to oranges
Single score makes everything comparable
The Formula

How to Calculate RICE Score: The Formula

RICE Score = (Reach × Impact × Confidence) ÷ Effort. The RICE framework was developed at Intercom to bring objectivity to feature prioritization. By multiplying Reach, Impact, and Confidence, then dividing by Effort, you get a single score that makes comparing features simple.

  • Reach: Number of users affected per quarter
  • Impact: Score from 0.25 (minimal) to 3 (massive)
  • Confidence: Percentage from 50% to 100%
  • Effort: Person-months or story points
  • Final score: Higher = build first
RICE scoring formula in ProductLift

RICE Scoring Scale: How to Rate Each Factor

Use these guidelines to score Reach, Impact, Confidence, and Effort consistently

Reach Scale (1-5)

5 dots = Affects most users, 4 = Many users, 3 = Some users, 2 = Few users, 1 = Very few. Think about what percentage of your customer base this feature will impact.

Impact Scale (1-5)

5 dots = Transformative (game-changing), 4 = High (significant improvement), 3 = Medium, 2 = Low, 1 = Minimal. How much will this improve the experience?

Confidence Scale (%)

100% = High confidence (data-backed), 80% = Medium (some evidence), 50% = Low (gut feeling). Be honest about uncertainty.

Effort Scale (1-5)

5 dots = Major project (3+ months), 4 = Significant (1-2 months), 3 = Medium (weeks), 2 = Small (days), 1 = Trivial. Higher effort = lower priority.

ProductLift RICE scoring AI interface suggesting scores
Score With Context

See Customer Feedback While You Score

ProductLift shows votes and conversion rates right next to each feature as you score. AI can even suggest RICE scores based on your product vision and customer votes - no more guessing.

  • AI suggests scores based on product vision and votes
  • Visual RICE graph to see where features sit
  • Drag and drop to easily reorder priorities
  • Votes & conversion rate visible for every feature
  • Visual dot scoring (1-5) for Impact, Reach, and Effort
  • Percentage-based Confidence scoring
  • Automatic RICE score calculation
  • One-click reorder by score

From Feedback to Shipped Features

RICE prioritization is just one part of the complete ProductLift workflow

1

Gather Feedback

Collect feature requests from customers. They can vote, comment, and explain why they need each feature.

2

Prioritize with RICE

Score features using RICE while seeing customer votes. Automatic calculations rank your backlog objectively.

3

Build Your Roadmap

Drag prioritized features onto your roadmap. Share publicly or with specific customer groups.

4

Announce & Notify

Publish changelog when you ship. Voters get notified automatically - closing the feedback loop.

Compare All Prioritization Frameworks

Choose the right method for your team - or switch between them anytime

RICE Framework

Most comprehensive. 4 factors: Reach × Impact × Confidence ÷ Effort. Best when you have good reach data and want maximum objectivity.

Current Framework

ICE Framework

Simpler & faster. 3 factors: Impact × Confidence × Ease. Best for quick decisions when features affect similar user groups.

Switch to ICE

MoSCoW Method

Stakeholder-friendly. Categories: Must, Should, Could, Won't. Best for release planning and communicating with non-technical teams.

Switch to MoSCoW

Impact-Effort Matrix

Most visual. 2×2 grid: Quick Wins, Big Bets, Fill-Ins, Time Sinks. Best for identifying obvious priorities at a glance.

Switch to Impact-Effort

RICE Prioritization Tool vs Excel Spreadsheets

Why product teams switch from RICE templates to dedicated tools

Before

With ProductLift

Manual RICE calculations in spreadsheets
Automatic score calculation as you click
No customer context while scoring
See votes & conversion for every feature
Copy-paste features to roadmap
Drag scored features directly to roadmap
No way to notify customers when you ship
Automatic email notifications to voters

Best RICE Prioritization Software Features

Everything you need to implement RICE scoring for your product backlog

Customer Context

See votes, conversion rates, and customer comments while you score. Know which features your highest-value customers want most.

Switch Frameworks Anytime

Start with RICE, switch to ICE for simpler scoring, or use MoSCoW for release planning. All frameworks available in one dropdown.

Close the Loop

When you ship a feature, voters get notified automatically. Show customers their feedback matters - improve retention and NPS.

Export Anywhere

Export your prioritized list to CSV, sync with Jira, or use the API. Your data isn't locked in.

Revenue-Based Prioritization

Connect Stripe to see MRR and LTV per voter. Prioritize based on which high-value customers are requesting features.

Learn About Stripe

User Segments

Create segments like 'Enterprise' or 'High MRR' and see what percentage of voters belong to each. Filter features by segment.

Learn About Segments

Trusted by Product Teams Worldwide

Sebastian F.

Sebastian F.

Entrepreneur

This app will help you connect with your users and gather feedback like never before. The UI is clean and focused. The different pages and forms can be fully customized. Ruben is an amazing developer and entrepreneur with a proven track record. ProductLift is going places and you should get onboard.
Aaron Dye

Aaron Dye

An excellent product with equally excellent support! Everything just works, and when I had questions, the team was incredibly responsive.
Timothy M.

Timothy M.

Product Manager

This tool is literally a needle in a haystack. I was using Frill, and this doesn't even compare. The user interface, the way it lays out — so amazing. Also amazing support team!
Ben

Ben

Product Owner

Helped us quickly move away from our antiquated spreadsheet to a user-interactive system. User feedback is now collected in real-time. Support has been super speedy!
Marco

Marco

Based in Europe, ideal for privacy-conscious customer interaction. Constant improvements by Ruben together with thorough support make ProductLift a solid and future-proof choice.
Chris R.

Chris R.

Founder

By far the most customizable of all the feedback tools and much better than Feedbear. Developer is super responsive and support has been great. Highly recommend!

RICE Prioritization FAQ

What is RICE prioritization?

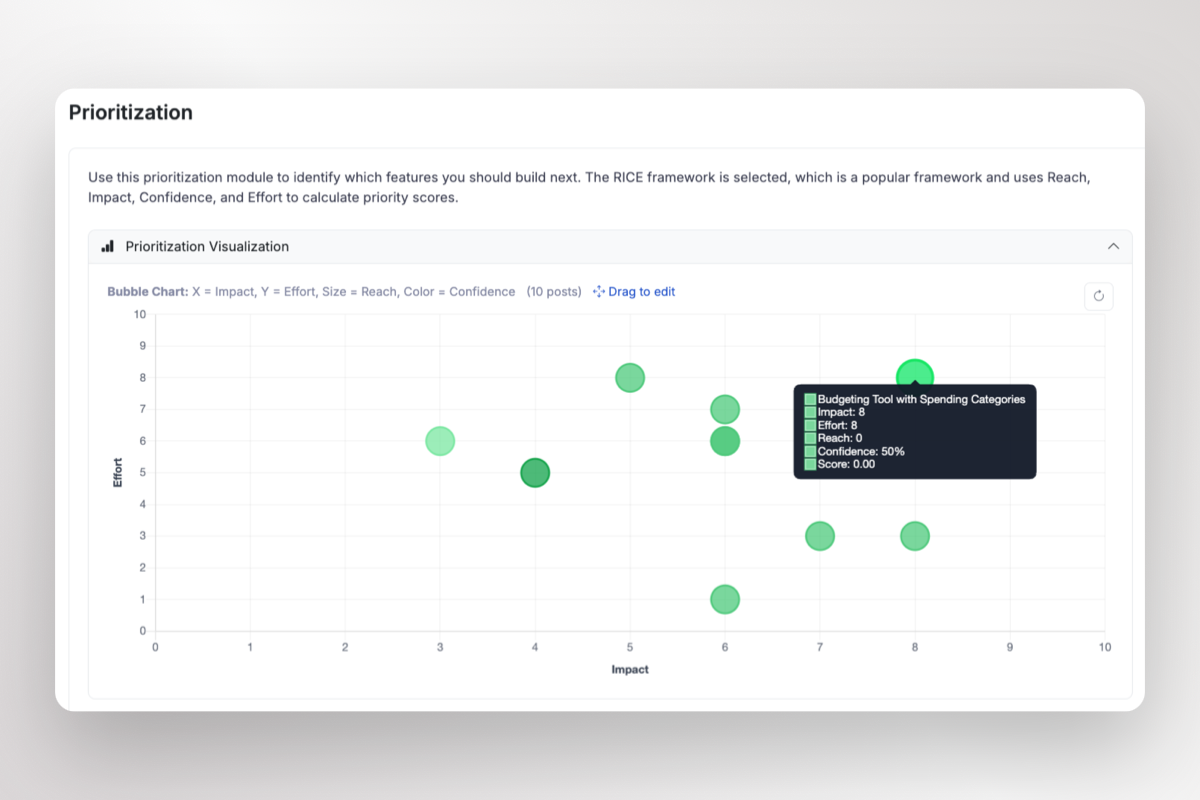
RICE is a scoring framework developed at Intercom for prioritizing features. It stands for Reach, Impact, Confidence, and Effort. By scoring each factor and calculating (Reach x Impact x Confidence) / Effort, you get a single number that makes comparing features objective and data-driven.

How do I calculate a RICE score?

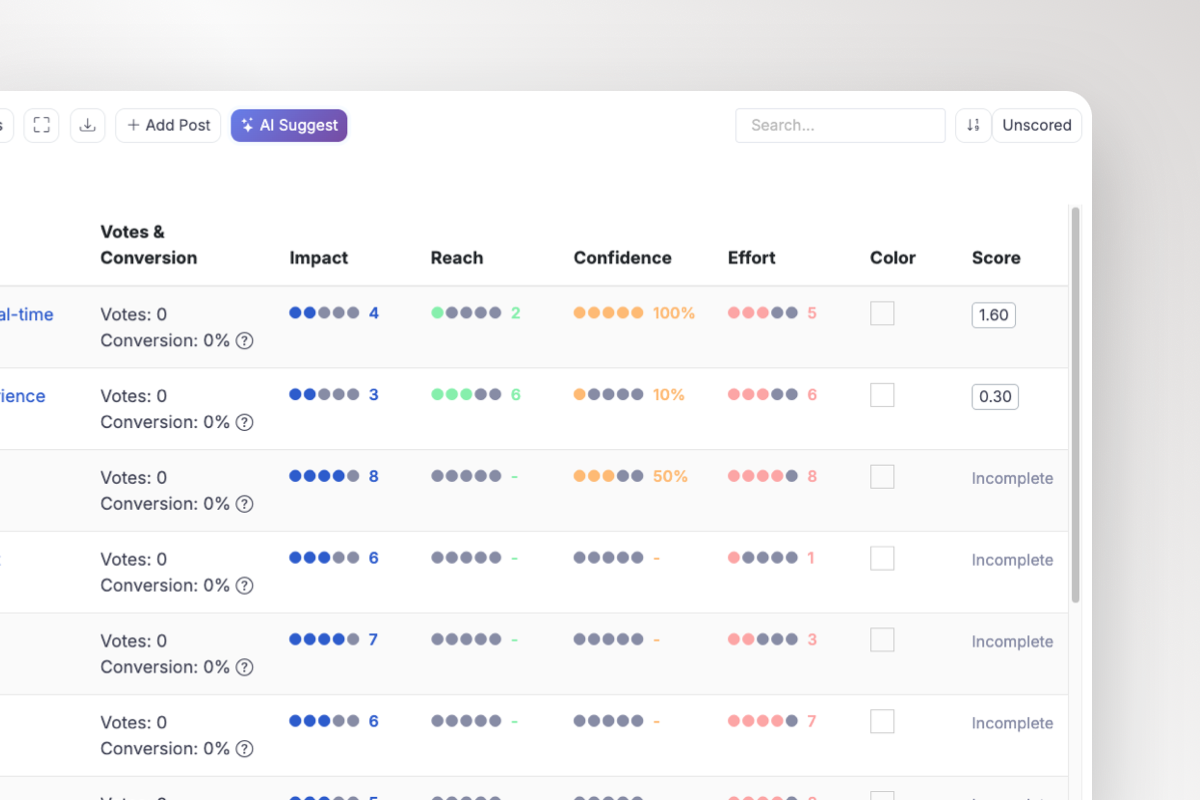
Multiply Reach (users affected) by Impact (0.25-3 scale) by Confidence (50-100%), then divide by Effort (person-months). For example: 10,000 users x 2 impact x 80% confidence / 2 months = 8,000 RICE score. Higher scores = higher priority.

What's a good RICE score?

RICE scores are relative, not absolute. Compare scores within your backlog rather than against a benchmark. A feature with score 5,000 is higher priority than one with 2,000. The exact numbers depend on your reach scale and effort estimates.

When should I use RICE vs ICE?

Use RICE when you have good data on how many users features will affect (Reach). Use ICE when features affect similar user groups or you don't have reach data. ICE is simpler with just 3 factors: Impact, Confidence, Ease.

Can my team collaborate on RICE scoring?

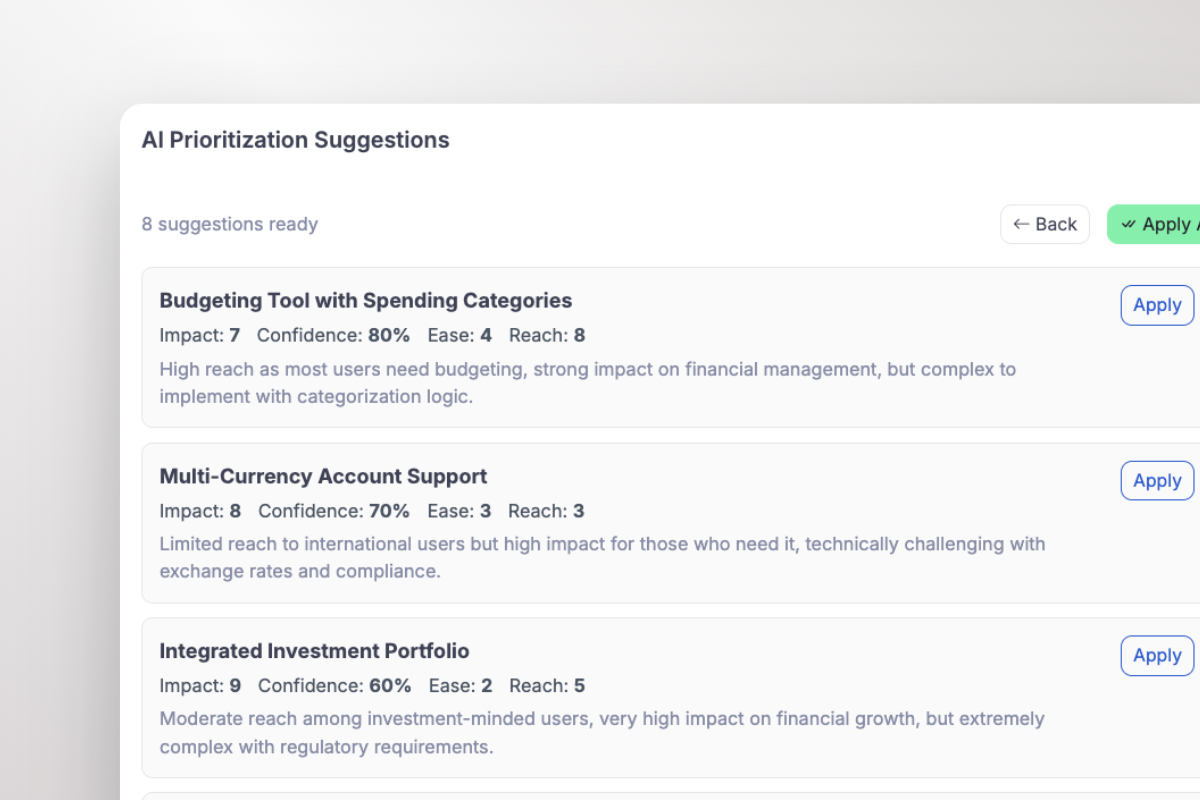
Yes! ProductLift supports team scoring where multiple people can score features. You can average scores, discuss disagreements, and reach consensus. This reduces individual bias and improves accuracy.

How often should I recalculate RICE scores?

Re-score when circumstances change: new user data, updated effort estimates, or shifted priorities. Many teams re-score quarterly or when planning sprints. ProductLift makes it easy to update scores as you learn more.

Free RICE Prioritization Resources

RICE calculator, Excel template, and complete guide

Free RICE Calculator

Calculate RICE scores instantly with our free online calculator.

Try Calculator

RICE Excel Template

Download our free RICE template for Excel or Google Sheets.

Download Template

Complete RICE Guide

Learn everything about RICE prioritization with examples.

Read Guide

Start Prioritizing with RICE Today

Join 6,000+ product teams making data-driven decisions with ProductLift.

14-day free trial · No credit card required · RICE, ICE, MoSCoW included