RICE prioritization helps you score features using four factors: Reach, Impact, Confidence, and Effort. Instead of debating opinions in meetings, you get a single number to rank each idea.
Here's how RICE works, with examples and a free template to get started.
You can also view the summary in this video:
If you are looking for a tool to do RICE prioritization, try RICE prioritization software.
RICE prioritization is a framework that helps product teams rank ideas or features based on Reach, Impact, Confidence, and Effort to determine their overall priority.
The RICE product management framework was developed by Intercom's product team and has gained popularity due to its comprehensive approach.
RICE prioritization helps you make a data-driven guess at priority. It's not perfect, but it helps you figure out which features are awesome and which ones you should probably skip.
RICE stands for four factors:
RICE Score = (Reach x Impact x Confidence) / Effort
It's like the classic impact/effort analysis, but with reach and confidence thrown in for good measure.
Let's break down each component and then we'll walk through the process of using RICE for prioritization.
Reach measures how many people your feature or project will affect within a specific time frame (usually a quarter). This could be the number of customers, users, or transactions.
Here's a suggested scale for Reach:
| Number of users affected per quarter | Score |
|---|---|
| >100,000 | 10 |
| 50,000 - 100,000 | 8 |
| 10,000 - 50,000 | 6 |
| 1,000 - 10,000 | 4 |
| 100 - 1,000 | 2 |
| <100 | 1 |
Examples
Impact measures how much a feature contributes to your goals. Before scoring impact, ensure your goals are clearly defined. A great tool for this is the Product Vision Board, which helps you articulate your vision, target group, needs, product, and business goals.
When scoring impact, use a 1-10 scale. Here's an example scale:
| Impact Description | Score |
|---|---|
| Transformative: Game-changing for the product | 10 |
| Very High: Significant improvement for many users | 8-9 |
| High: Notable improvement for some users | 6-7 |
| Medium: Moderate improvement for a few users | 4-5 |
| Low: Minor improvement for a small number of users | 2-3 |
| Very Low: Barely noticeable improvement | 1 |
Examples
Confidence helps distinguish between data-backed ideas and mere opinions. It's crucial to involve your team when determining confidence scores, as different perspectives can reveal potential concerns.
Here's a scale you can use for Confidence:
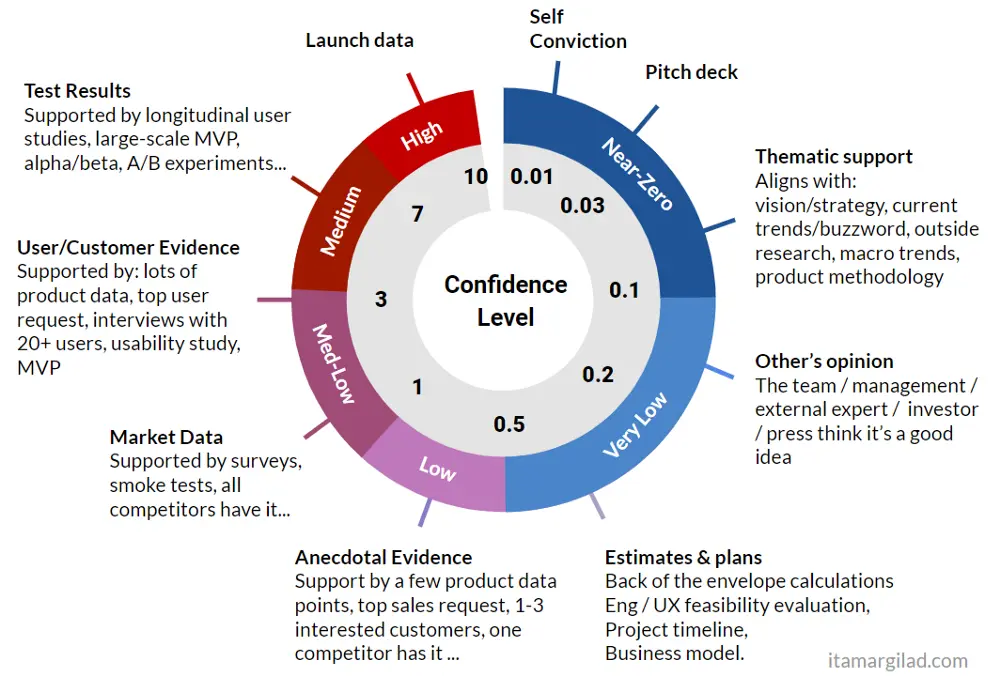
(Source: Itamar Gilad)
Effort is all about how hard it is to implement something. Think of this as the traditional effort factor. How many person-months will it take to build?
Here's an example scale for Effort:
| Person months | Effort |
|---|---|
| < 1 month | 1 |
| 1-2 months | 2 |
| 2-3 months | 3 |
| 4-6 months | 4 |
| 6-12 months | 5 |
| > 12 months | 6 |
Examples
Now that we understand the components, let's walk through the process of using RICE for prioritization.
First things first, make a list of all the tasks and features you're thinking about.
Try to keep things MECE (Mutually Exclusive, Collectively Exhaustive). This means your items should not overlap (mutually exclusive) and should cover all possibilities (collectively exhaustive).
For example, "SSO login" and "Tagging" are on the same level and don't overlap. But "Change button color" and "Build a whole new app" are definitely not on the same level.
Take your time to make a good list. It's a pain when you're halfway through prioritizing and someone throws in a new idea. I usually ask customers, partners, and coworkers for their input using surveys or a feedback tool.
Let's add the list in the Score-based Prioritization module:
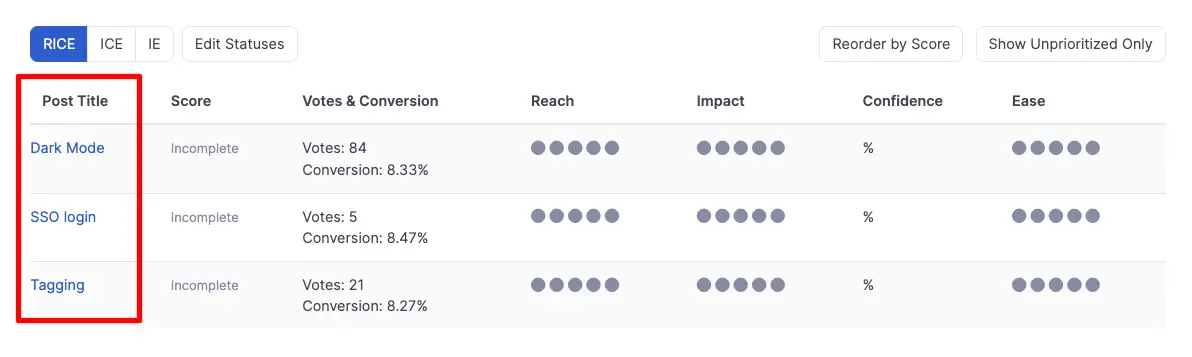
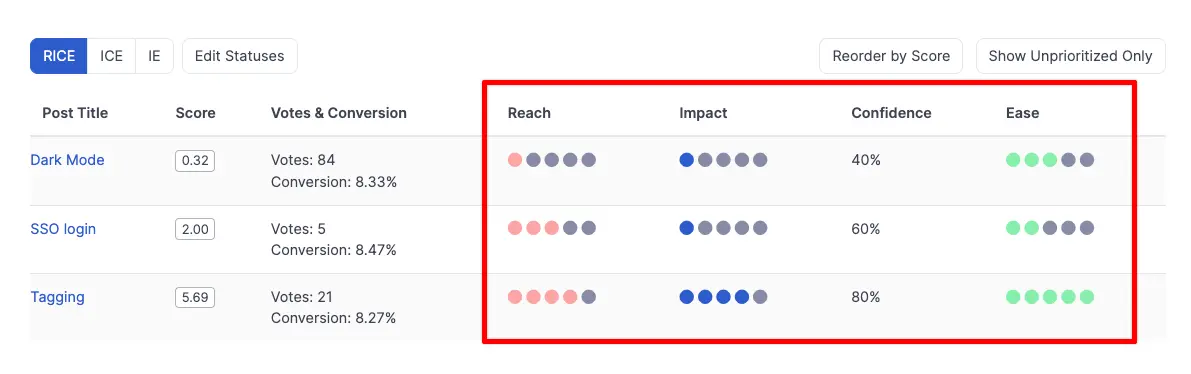
Now, go through your list and score each item on Reach, Impact, Confidence, and Effort using the scales we discussed earlier.
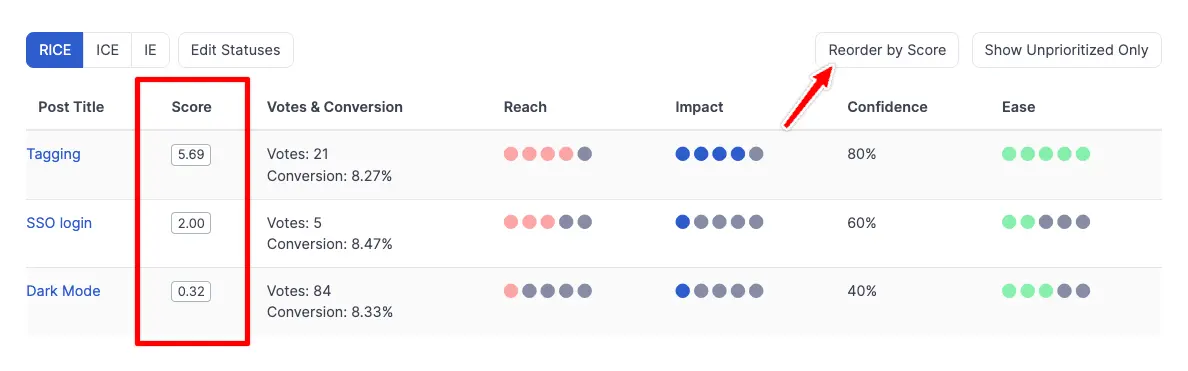
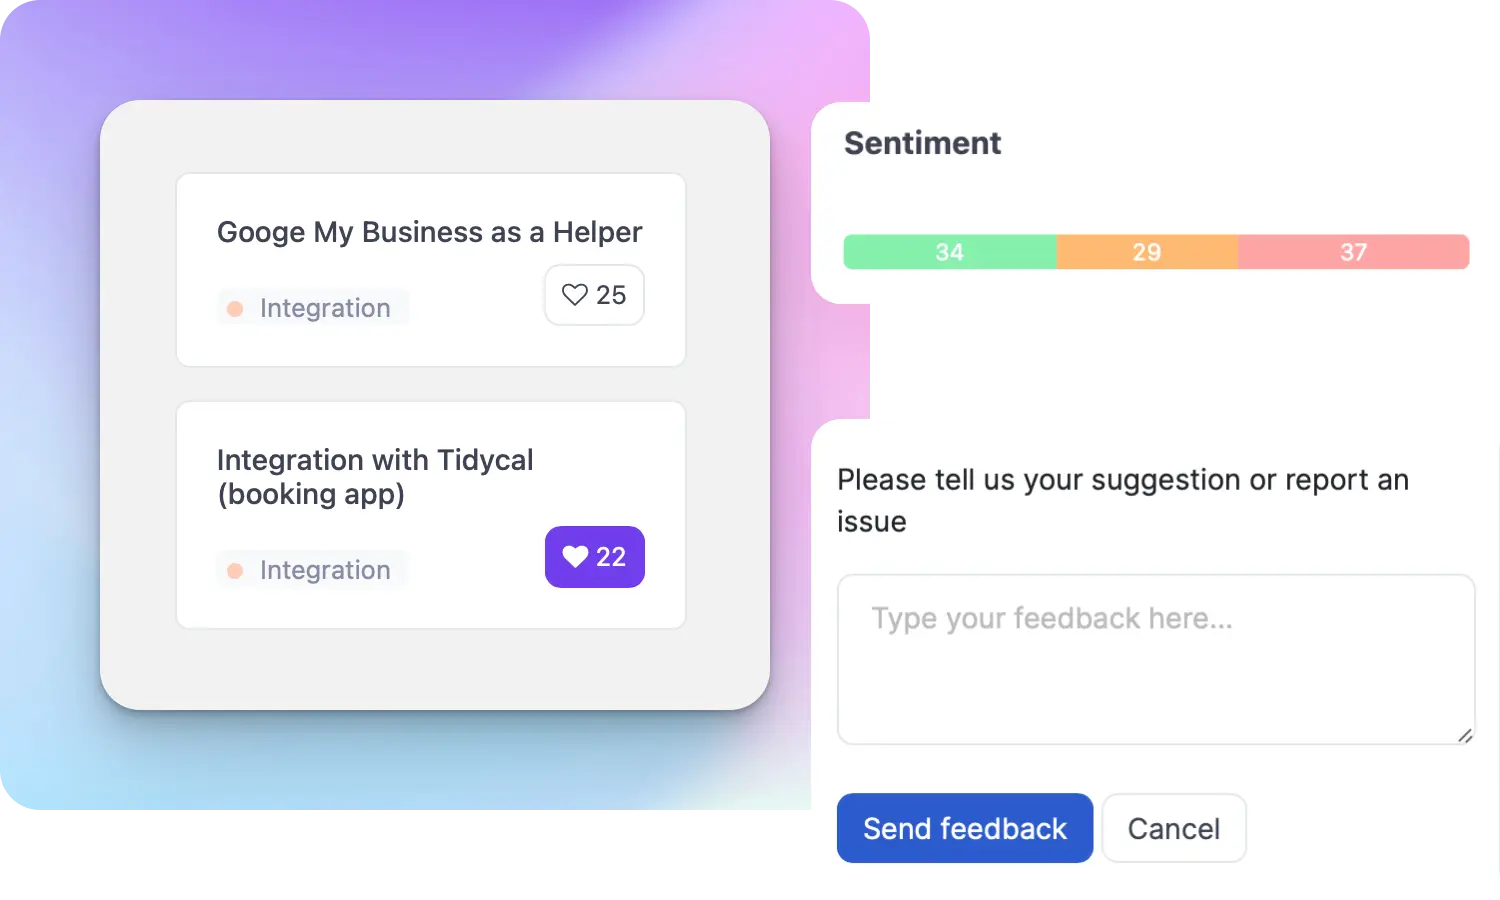
In our RICE product management tool, we make decisions based on how many votes a feature gets. We also look at conversion, which is likes divided by views. Even though the SSO login feature has fewer votes, it has the highest conversion rate, showing it's important.
Now it's time to do some math! The RICE score calculation is:
Priority = (Reach x Impact x Confidence) / Effort
After entering all the data, the tool automatically calculates the RICE score. You can also use this online RICE score calulator.
With the RICE scores calculated, we can reorder the list to view features from highest to lowest priority. This helps in identifying which features should be addressed first.
After calculating the scores, it's important to review the results with your team and key stakeholders. This step helps catch any oversights and ensures everyone is aligned on the priorities.
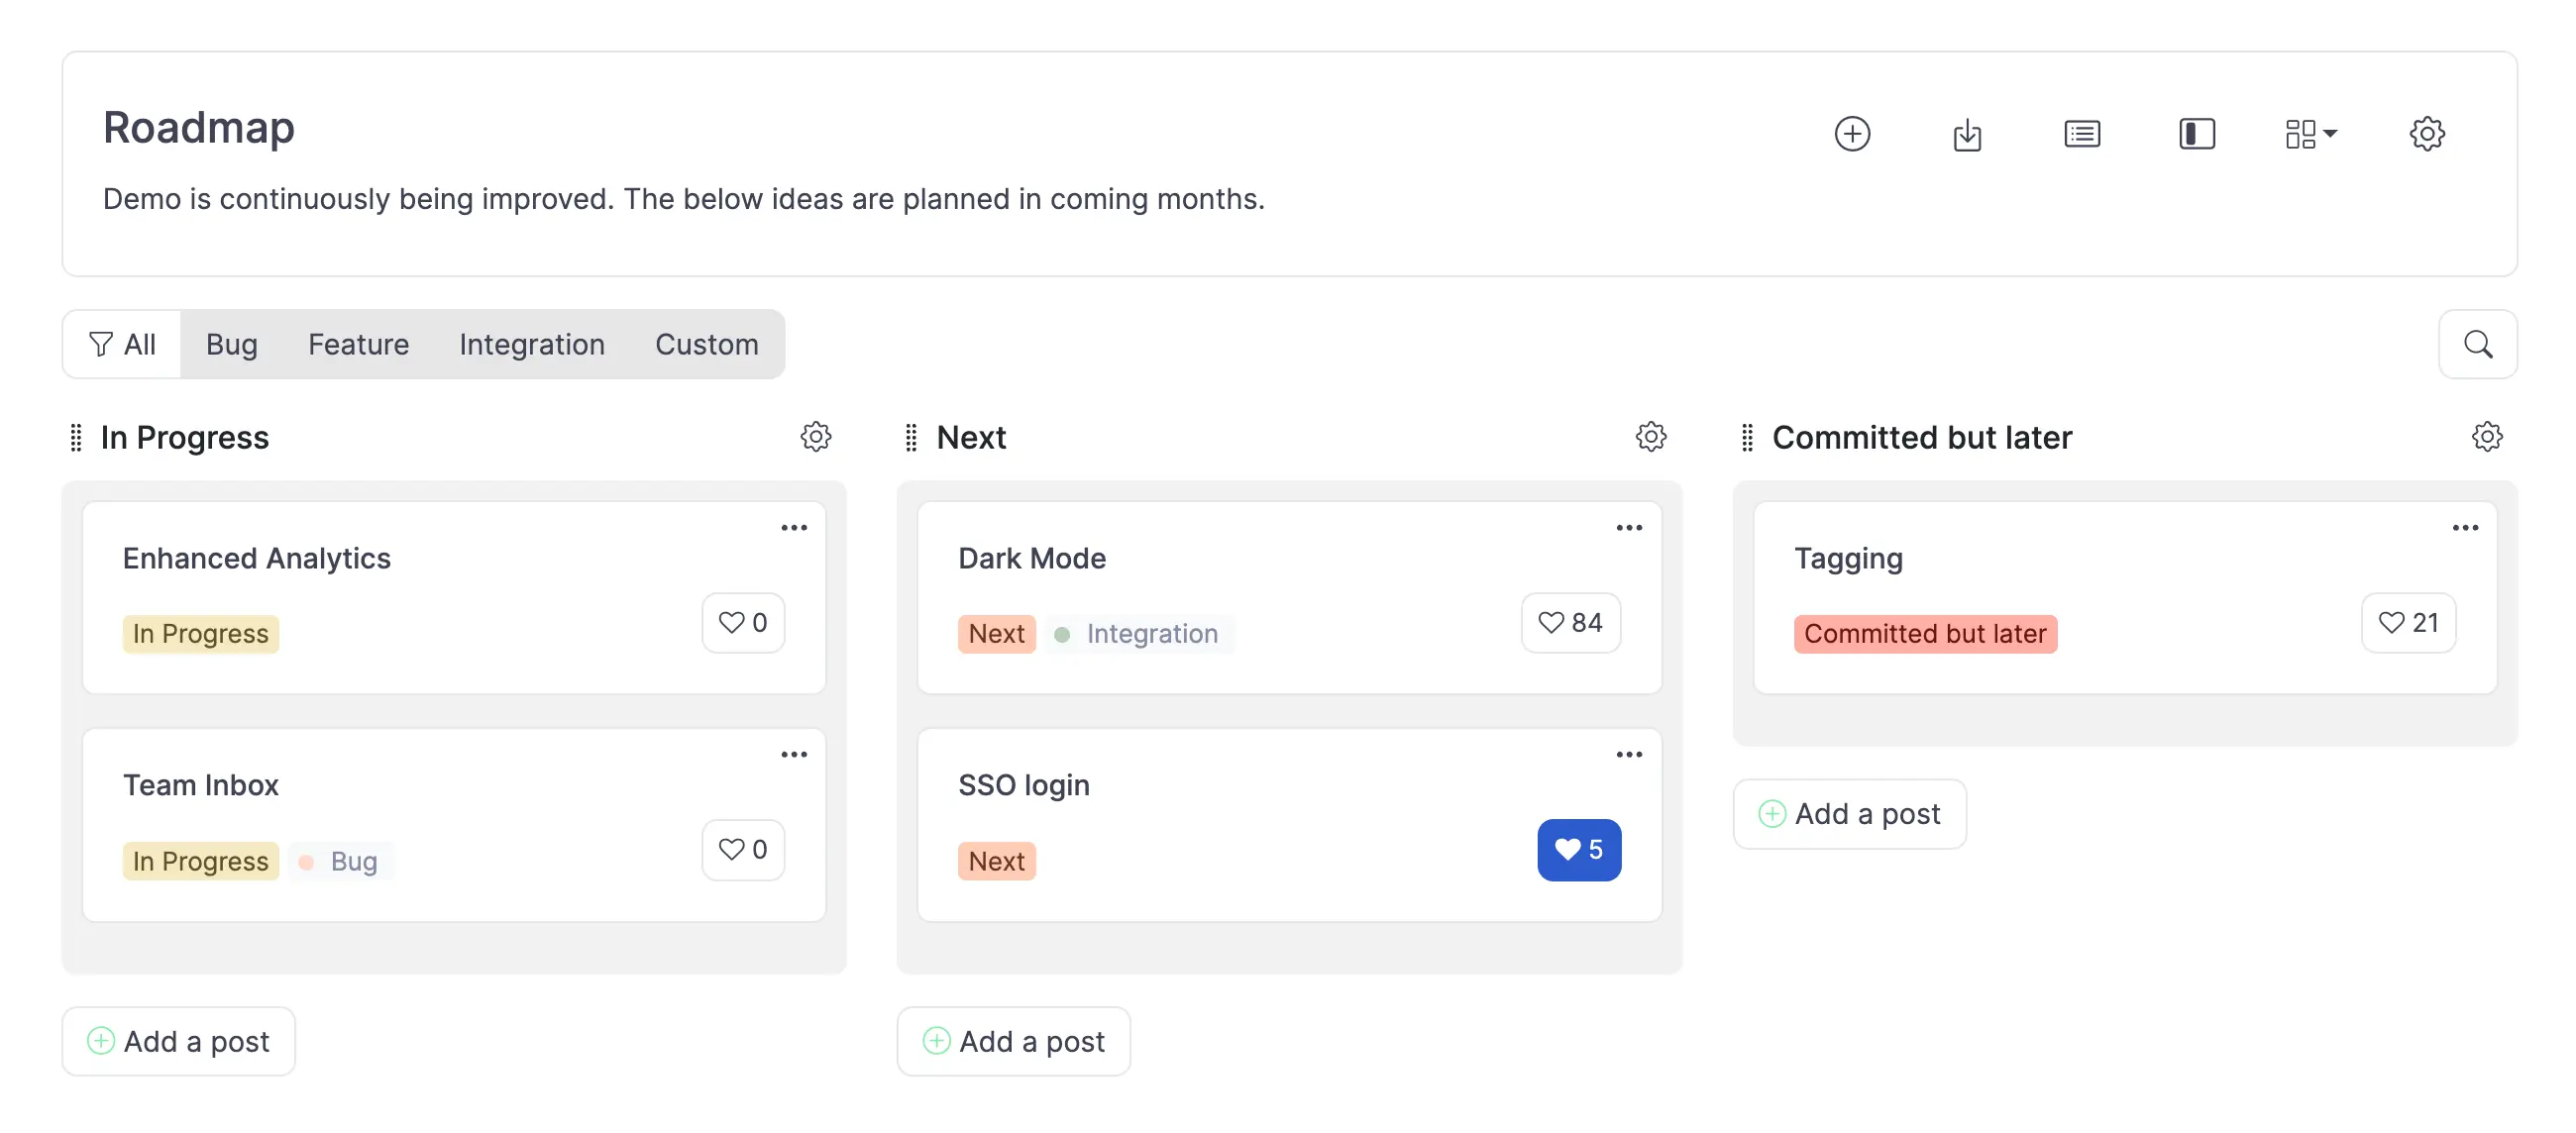
Finally, with all the data entered, we can use this input to determine the roadmap.
We review each item on the list. In ProductLift, we can change the status of the items we have reviewed. This step immediately updates users that voted for the feature request.
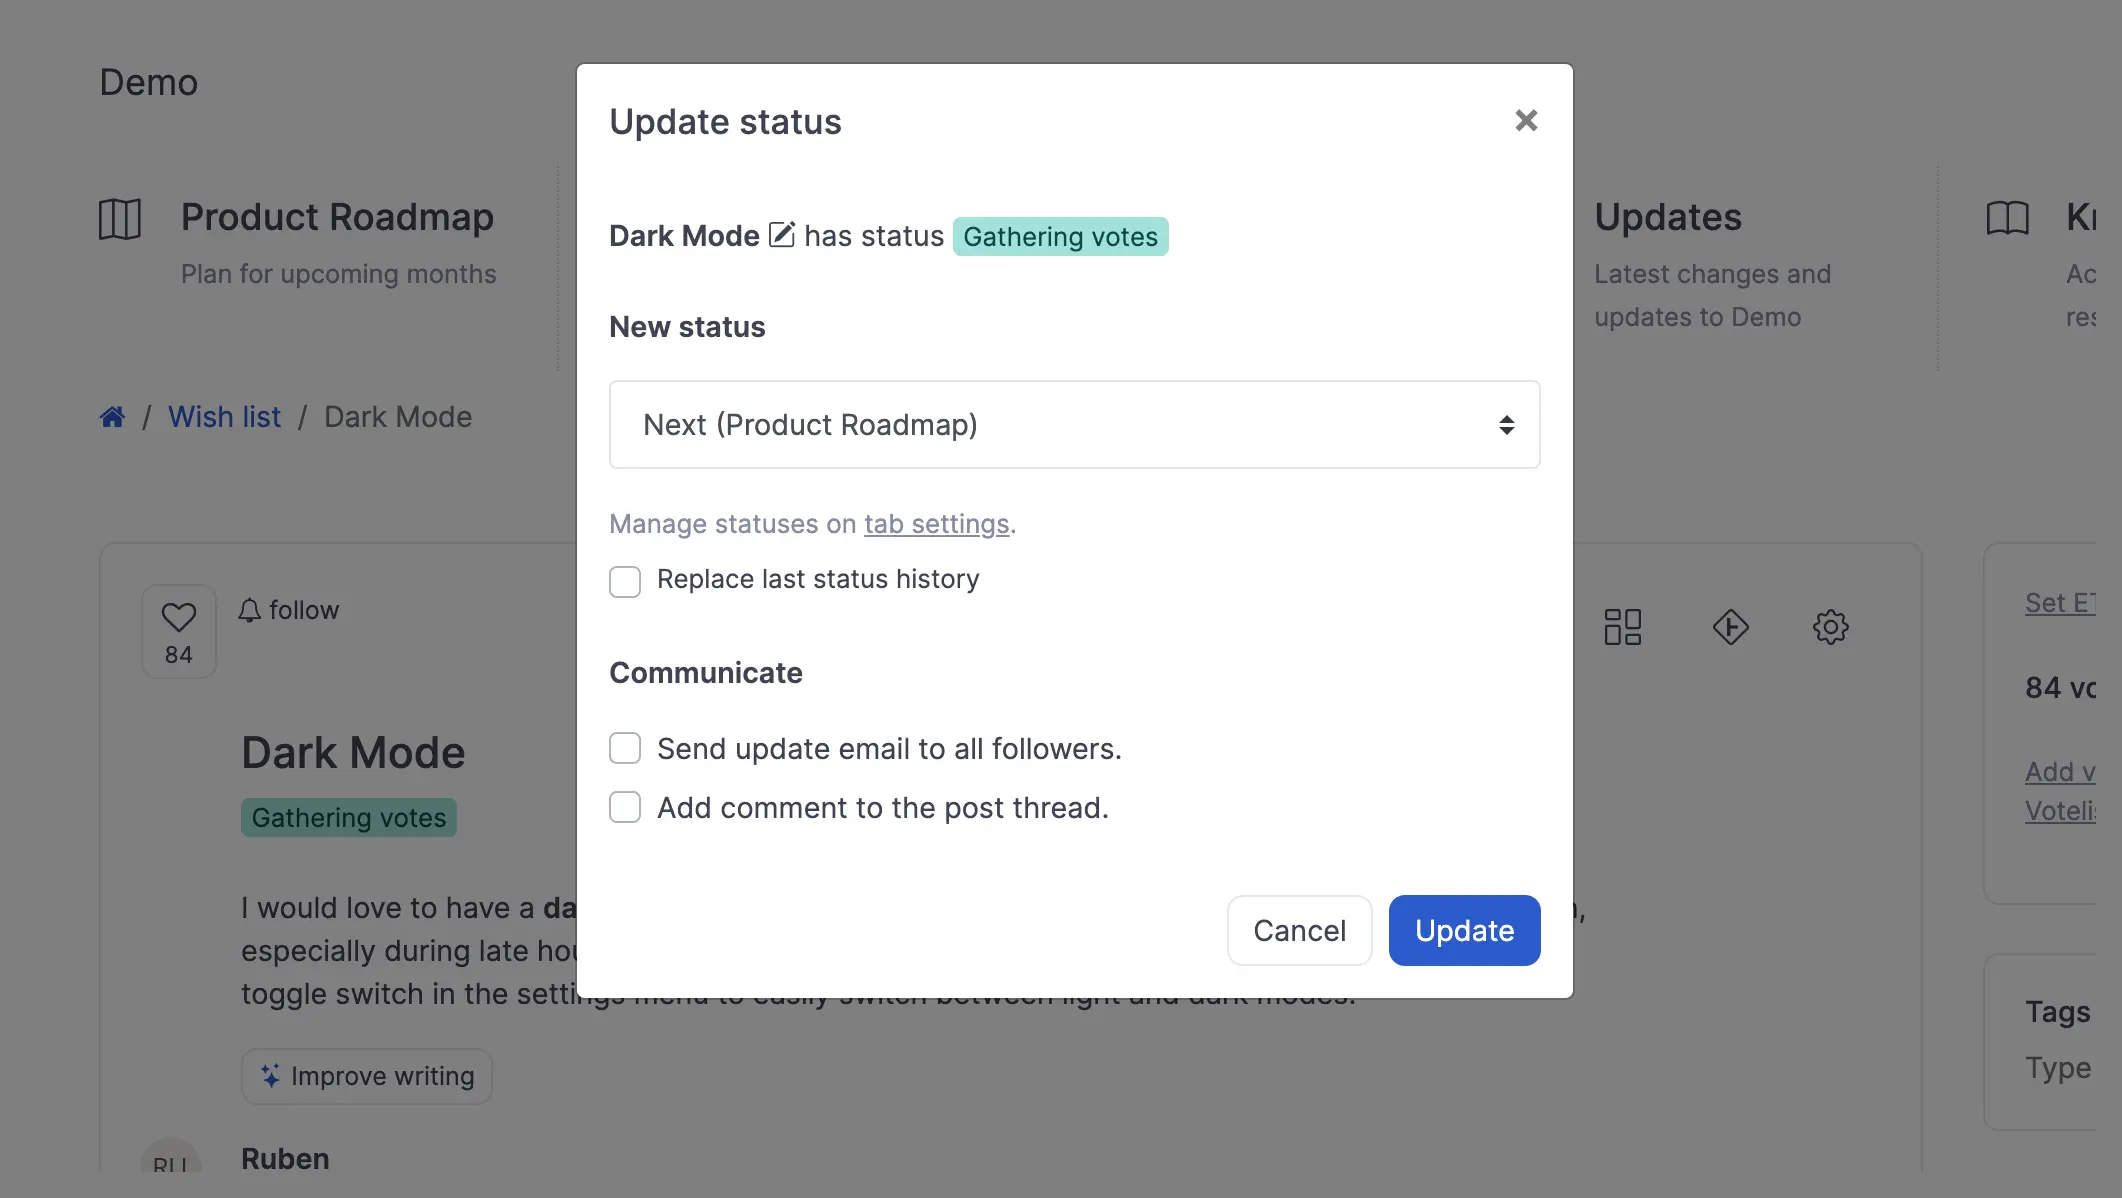
As we update the statuses of the items, they are automatically added to our roadmap. This ensures that our roadmap is always up-to-date with the latest priorities and statuses.
Instead of using a tool like ProductLift, you can also use our Google Sheets RICE template or our Excel RICE template and we even have a PowerPoint template.
Many successful companies have used RICE to drive their product development. Here are a couple of examples:

Routespring, a fast-growing startup optimizing business travel management for centralized payments, uses a modified version of the RICE model called SU-RICE (Source-User RICE) for prioritizing their product features. By focusing on ideas that score highest in their adapted framework, Routespring has been able to develop features that streamline travel booking processes and improve user experience for their corporate clients.
![]()
Intercom, the messaging software company that originally developed the RICE framework, used it to improve their internal decision-making processes for product development. By implementing RICE, Intercom was able to objectively determine which features to build first, based on their potential value and the effort required. This approach helped Intercom grow rapidly and become a leader in the customer communication platform space.
While the RICE framework is a powerful tool, it can be time-consuming to implement manually, especially for a large number of features. This is where AI-powered prioritization can come in handy.
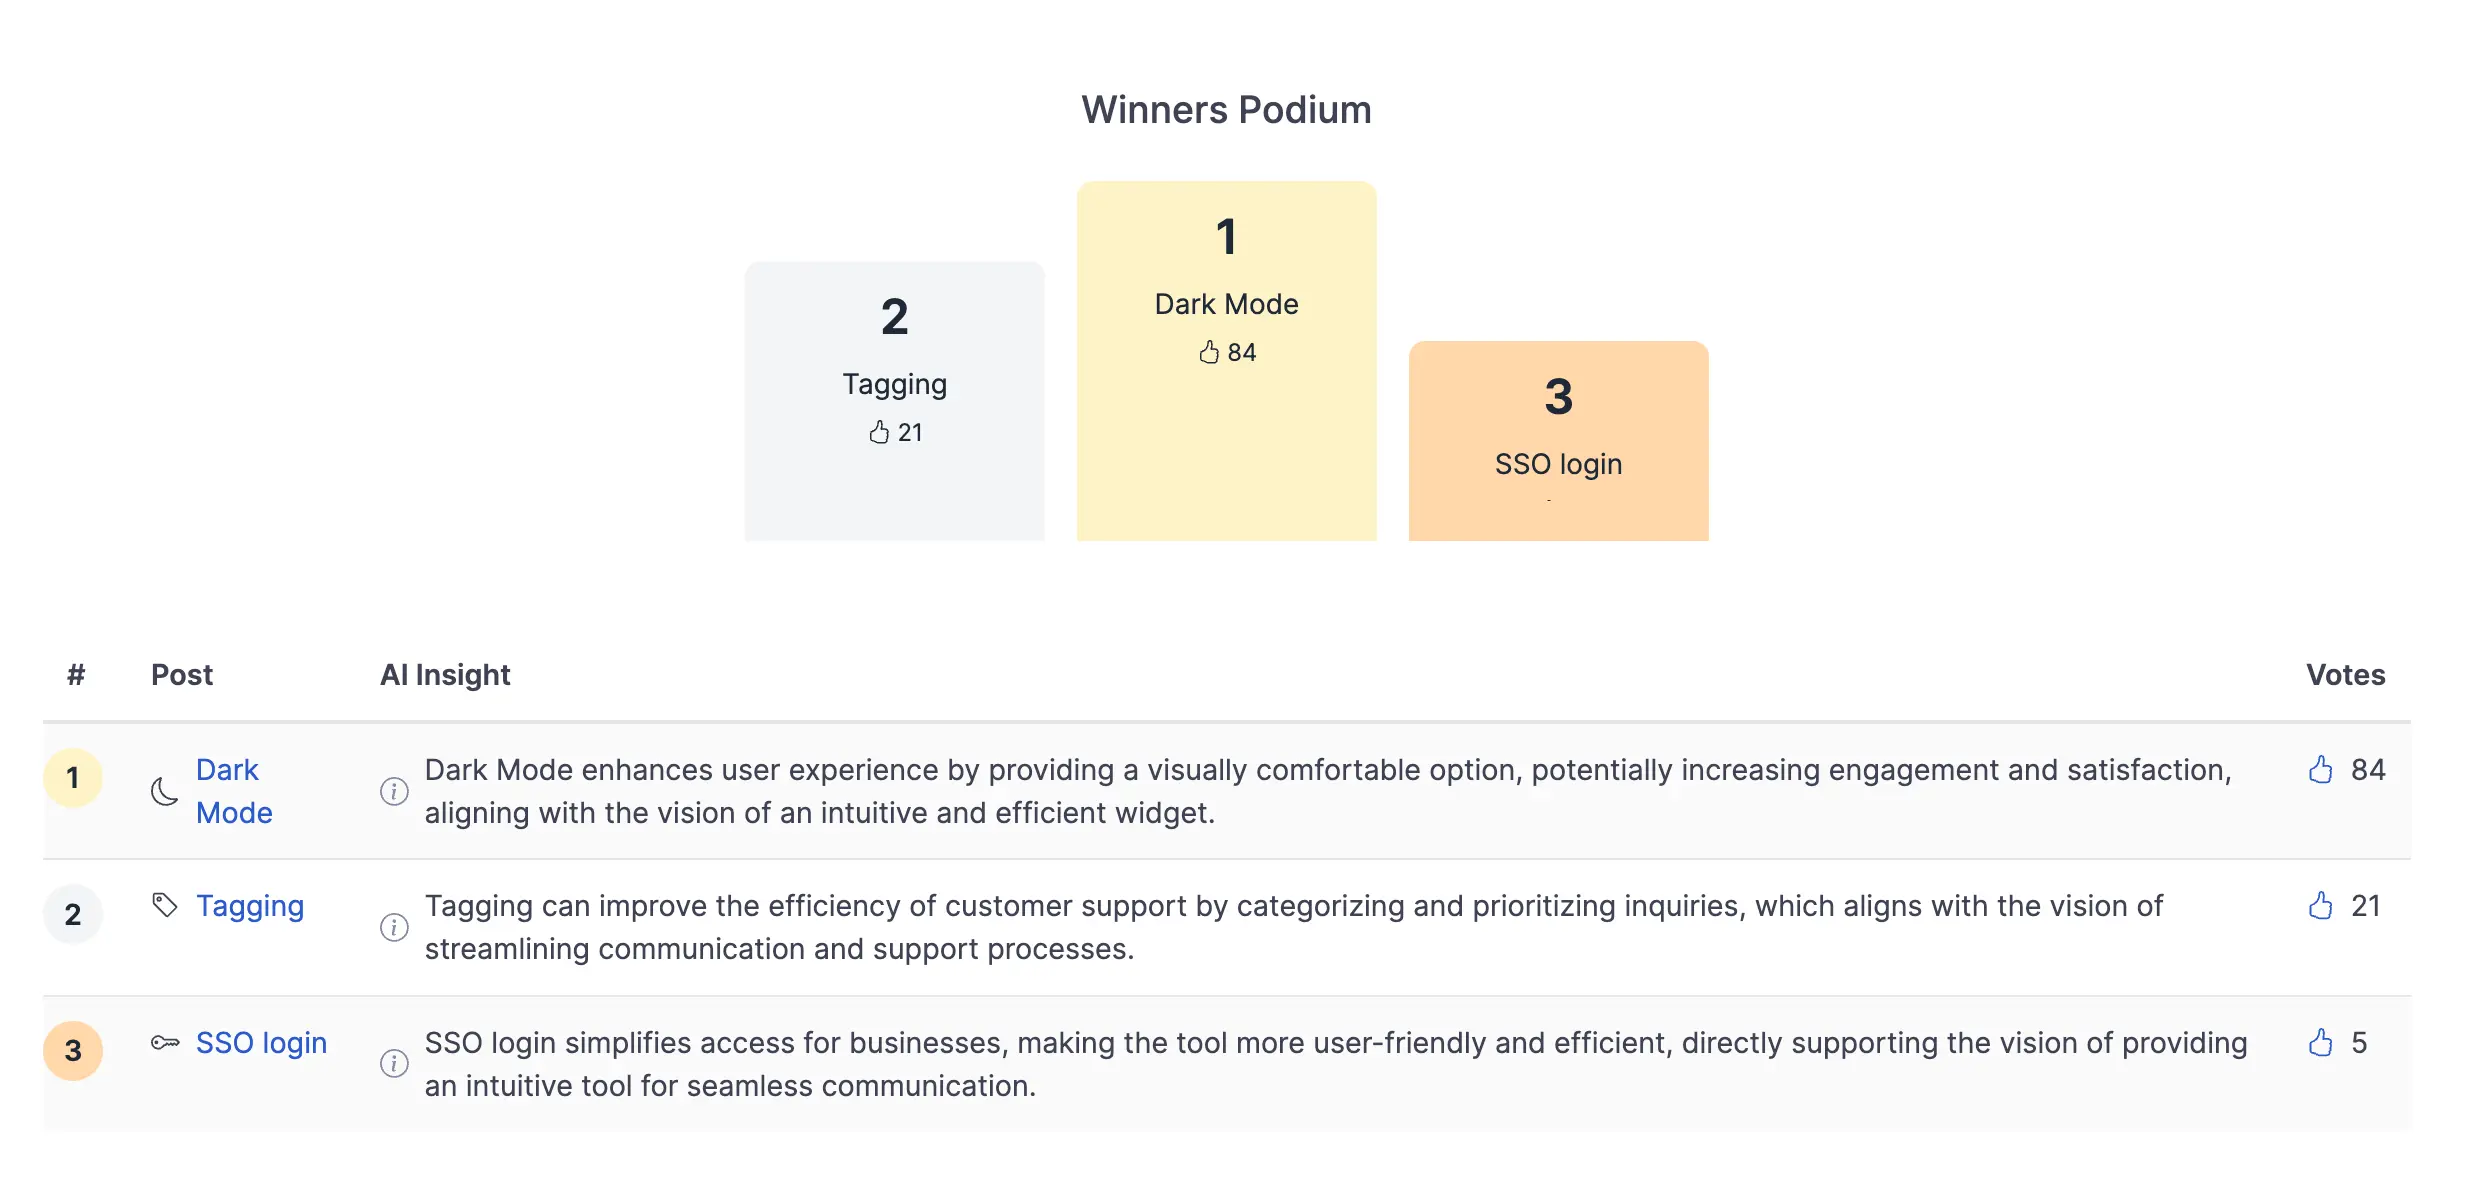
The AI prioritization feature helps us decide which features to focus on in 30 seconds.
We start by setting up our product vision and adding features we want to consider. As users vote on their favorites, the AI analyzes this data and our vision to find the top 5 features.
ICE is another popular prioritization framework that stands for Impact, Confidence, and Ease. The main difference is the absence of the Reach factor in ICE.
So which is better? It depends on your needs:
In general, if you're just starting out or need to make quick decisions, ICE prioritization might be a good choice (try the free ICE calculator). As your product matures and you have more data about your users, RICE can provide more nuanced prioritization.
For a detailed comparison of both frameworks, see our RICE vs ICE guide.
The RICE prioritization framework can be a powerful tool for product managers, but it's important to use it properly. Here are some do's and don'ts to keep in mind when applying RICE:
Do:
Don't:
RICE prioritization is a framework that helps product teams rank ideas or features based on Reach, Impact, Confidence, and Effort to determine their overall priority.
RICE in prioritization is a framework used to rank ideas or features based on four factors: Reach, Impact, Confidence, and Effort. It helps teams prioritize tasks to maximize value while considering the resources required.
The RICE formula priority is calculated by multiplying Reach, Impact, and Confidence, then dividing by Effort. This formula provides a score that helps product teams prioritize features based on potential value and feasibility.
RICE is an acronym that stands for Reach, Impact, Confidence, and Effort.
The RICE scoring model assigns a numeric value to each component of the acronym (Reach, Impact, Confidence, and Effort) and multiplies them together to calculate a final score. This score helps prioritize ideas or features, with higher scores indicating higher priority.
'Reach' refers to the number of users or customers who will be affected by implementing a particular idea or feature. It helps determine the potential audience size for a given initiative.
'Impact' refers to the expected positive outcome or benefit that implementing a particular idea or feature will bring to users or customers. It helps assess the magnitude of the potential change.
'Confidence' refers to the level of certainty or belief that the estimated Reach and Impact of a particular idea or feature will actually occur. It helps account for uncertainties in the evaluation process.
'Effort' refers to the resources, time, and effort required to implement a particular idea or feature. It helps evaluate the feasibility and practicality of executing a given initiative.
The components of the RICE scoring model are typically weighted on a scale from 1 to 10, with 10 being the highest. The specific weights assigned to each component may vary based on the organization's priorities and context.
Yes, the RICE scoring model can be customized to fit the specific needs and goals of a product management team. The weights assigned to each component can be adjusted, and additional factors can be included in the evaluation process if desired.
The RICE scoring model helps product managers make informed decisions by providing a systematic and quantitative approach to prioritize ideas or features. It allows teams to focus on initiatives with high potential impact and feasibility, leading to better resource allocation and improved product outcomes.
Prioritizing features is tough and takes time and discipline. The RICE scoring model helps you make a data-driven estimate of priority. Now you have the tools to do this for your product.
Remember to revisit your RICE scores regularly, as your experience, goals, and confidence will change over time.
Finally, share your priority outcomes with your customers and stakeholders using your product roadmap or kanban board. This keeps everyone aligned and excited about what's coming next!
Join over 5,204 product managers and see how easy it is to build products people love.
Did you know 80% of software features are rarely or never used? That's a lot of wasted effort.
SaaS software companies spend billions on unused features. In 2025, it was $29.5 billion.
We saw this problem and decided to do something about it. Product teams needed a better way to decide what to build.
That's why we created ProductLift - to put all feedback in one place, helping teams easily see what features matter most.
In the last five years, we've helped over 5,204 product teams (like yours) double feature adoption and halve the costs. I'd love for you to give it a try.

Founder & Digital Consultant
See how real product teams use RICE, ICE, MoSCoW, and other prioritization frameworks. 6 practical examples with actual scores, decisions, and outcomes.
A practical guide for choosing the right prioritization framework. Answer 4 questions to find the best fit for your team size, data, and decisions.
Compare 10 prioritization frameworks side by side. RICE, ICE, MoSCoW, Kano, and more scored on complexity, data needs, and best use cases.
The best prioritization frameworks for startups at every stage. From pre-PMF to growth, learn which framework fits your team size, data, and speed requirements.
Learn when to promote feature requests to your roadmap, how to merge duplicates, notify voters, and keep credibility through the full lifecycle.
With bike energy  from Utrecht
Ruby Foundry B.V. - KVK: 99995662 - BTW: NL869219789B01